Quantifying New York’s 2009 June gloom using WeatherBill and Wolfram|Alpha
In the northeastern United States, scars are slowly healing from a miserably rainy June — torturous, according to the New York Times. Status updates bemoaned “where’s the sun?”, “worst storm ever!”, “worst June ever!”. Torrential downpours came and went with Florida-like speed, turning gloom into doom: “here comes global warming”.
But how extreme was the month, really? Was our widespread misery justified quantitatively, or were we caught in our own self-indulgent Chris Harrisonism, “the most dramatic rose ceremony EVER!”.
This graphic shows that, as of June 20th, New York City was on track for near-record rainfall in inches. But that graphic, while pretty, is pretty static, and most people I heard complained about the number of days, not the volume of rain.
I wondered if I could use online tools to determine whether the number of rainy days in June was truly historic. My first thought was to try Wolfram|Alpha, a great excuse to play with the new math engine.
Wolfram|Alpha queries for “rain New Jersey June 200Y” are detailed and fascinating, showing temps, rain, cloud cover, humidity, and more, complete with graphs (hint: click “More”). But they don’t seem to directly answer how many days it rained at least some amount. The answer is displayed graphically but not numerically (the percentage and days of rain listed appears to be hours of rain divided by 24). Also, I didn’t see how to query multiple years at a time. So, in order to test whether 2009 was a record year, I would have to submit a separate query for each year (or bypass the web interface and use Mathematica directly). Still, Wolfram|Alpha does confirm that it rained 3.8 times as many hours in 2009 as 2008, already one of the wetter months on record.
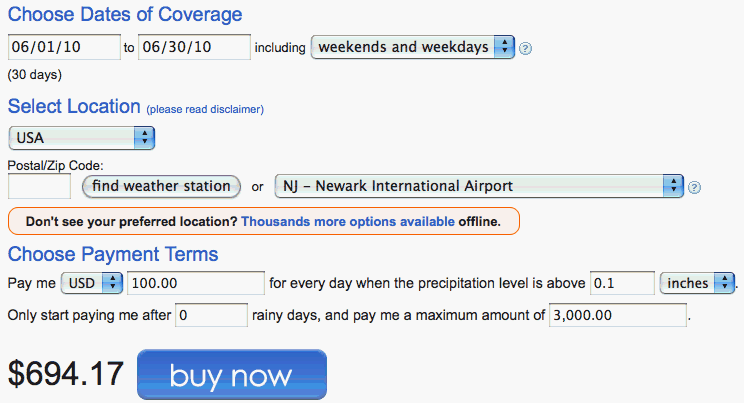
WeatherBill, an endlessly configurable weather insurance service, more directly provided what I was looking for on one page. I asked for a price quote for a contract paying me $100 for every day it rains at least 0.1 inches in Newark, NJ during June 2010. It instantly spat back a price: $694.17.

It also reported how much the contract would have paid — the number of rainy days times $100 — every year from 1979 to 2008, on average $620 for 6.2 days. It said I could “expect” (meaning one standard deviation, or 68% confidence interval) between 3.9 and 8.5 days of rain in a typical year. (The difference between the average and the price is further confirmation that WeatherBill charges a 10% premium.)
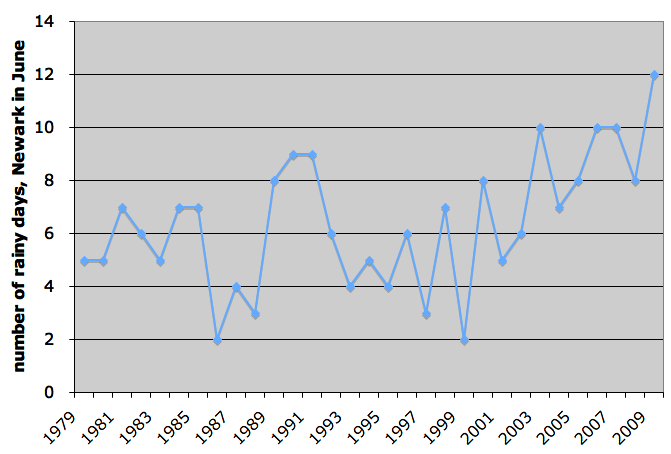
Below is a plot of June rainy days in Newark, NJ from 1979 to 2009. (WeatherBill doesn’t yet report June 2009 data so I entered 12 as a conservative estimate based on info from Weather Underground.)

Indeed, our gloominess was justified: it rained in Newark more days in June 2009 than any other June dating back to 1979.
Intriguingly, our doominess may have been justified too. You don’t have to be a chartist to see an upward trend in rainy days over the past decade.
WeatherBill seems to assume as a baseline that past years are independent unbiased estimates of future years — usually not a bad assumption when it comes to weather. Still, if you believe the trend of increasing rain is real, either due to global warming or something else, WeatherBill offers a temptingly good bet. At $694.17, the contract (paying $100 per rainy day) would have earned a profit in 7 of the last 7 years. The chance of that streak being a coincidence is less than 1%.
If anyone places this bet, let me know. I would love to, but as of now I’m roughly $10 million in net worth short of qualifying as a WeatherBill trader.