Category Archives: science

A toast to the number 303: A redemptive election night for science, and The Signal

The night of February 15, 2012, was an uncomfortable one for me. Not a natural talker, I was out of my element at a press dinner organized by Yahoo! with journalists from the New York Times, Fast Company, MIT Tech Review, Forbes, SF Chronicle, WIRED, Reuters, and several more [1]. Even worse, the reporters kept leading with, “wow, this must a big night for you, huh? You just called the election.”

We were there to promote The Signal, a partnership between Yahoo! Research and Yahoo! News to put a quantitative lens on the election and beyond. The Signal was our data-driven antidote to two media extremes: the pundits who commit to statements without evidence; and some journalists who, in the name of balance, commit to nothing. As MIT Tech Review billed it, The Signal would be the “mother of all political prediction engines”. We like to joke that that quote undersold us: our aim was to be the mother of all prediction engines, period. The Signal was a broad project with many moving parts, featuring predictions, social media analysis, infographics, interactives, polls, and games. Led by David “Force-of-Nature” Rothschild, myself, and Chris Wilson, the full cast included over 30 researchers, engineers, and news editors [2]. We confirmed quickly that there’s a clear thirst for numeracy in news reporting: The Signal grew in 4 months to 2 million unique users per month [3].

On that night, though, the journalists kept coming back to the Yahoo! PR hook that brought them in the door: our insanely early election “call”. At that time in February, Romney hadn’t even been nominated.

No, we didn’t call the election, we predicted the election. That may sound like the same thing but, in scientific terms, there is a world of difference. We estimated the most likely outcome – Obama would win 303 Electoral College votes, more than enough to return him to the White House — and assigned a probability to it. Of less than one. Implying a probability of more than zero of being wrong. But that nuance is hard to explain to journalists and the public, and not nearly as exciting.

Although most of our predictions were based on markets and polls, the “303” prediction was not: it was a statistical model trained on historical data of past elections, authored by economists Patrick Hummel and David Rothschild. It doesn’t even care about the identities of the candidates.

I have to give Yahoo! enormous credit. It took a lot of guts to put faith in some number-crunching eggheads in their Research division and go to press with their conclusions. On February 16, Yahoo! went further. They put the 303 prediction front and center, literally, as an “Exclusive” banner item on Yahoo.com, a place that 300 million people call home every month.

The Signal 303 prediction "Exclusive" top banner item on Yahoo.com 2012-02-16

The firestorm was immediate and monstrous. Nearly a million people read the article and almost 40,000 left comments. Writing for Yahoo! News, I had grown used to the barrage of comments and emails, some comic, irrelevant, or snarky; others hateful or alert-the-FBI scary. But nothing could prepare us for that day. Responses ranged from skeptical to utterly outraged, mostly from people who read the headline or reactions but not the article itself. How dare Yahoo! call the election this far out?! (We didn’t.) Yahoo! is a mouthpiece for Obama! (The model is transparent and published: take it for what it’s worth.) Even Yahoo! News editor Chris Suellentrop grew uncomfortable, especially with the spin from Homepage (“Has Obama won?”) and PR (see “call” versus “predict”), keeping a tighter rein on us from then on. Plenty of other outlets “got it” and reported on it for what it was – a prediction with a solid scientific basis, and a margin for error.

This morning, with Florida still undecided, Obama had secured exactly 303 Electoral College votes.
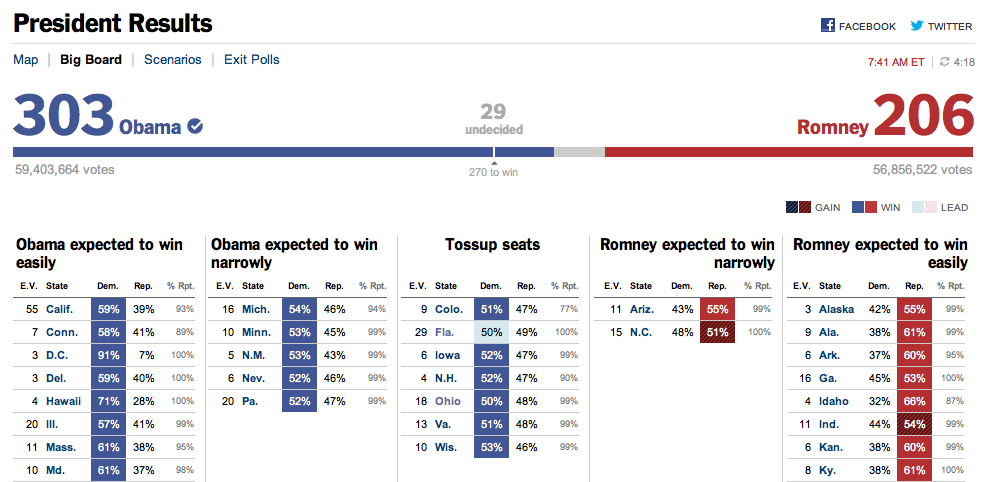
New York Times 2012 election results Big Board 2011-11-07

Just today Obama wrapped up Florida too, giving him 29 more EVs than we predicted. Still, Florida was the closest vote in the nation, and for all 50 other entities — 49 states plus Washington D.C. — we predicted the correct outcome back in February. The model was not 100% confident about every state of course, formally expecting to get 6.8 wrong, and rating Florida the most likely state to flip from red to blue. The Hummel-Rothschild model, based only on a handful of variables like approval rating and second-quarter economic trends, completely ignored everything else of note, including money, debates, bail outs, binders, third-quarter numbers, and more than 47% of all surreptitious recordings. Yet it came within 74,000 votes of sweeping the board. Think about that the next time you hear an “obvious” explanation for why Obama won (his data was biggi-er!) or why Romney failed (too much fundraising!).

Kudos to Nate Silver, Simon Jackman, Drew Linzer, and Sam Wang for predicting all 51 states correctly on election eve.

As Felix Salmon said, “The dominant narrative, the day after the presidential election, is the triumph of the quants.” Mashable’s Chris Taylor remarked, “here is the absolute, undoubted winner of this election: Nate Silver and his running mate, big data.” ReadWrite declared, “This is about the triumph of machines and software over gut instinct. The age of voodoo is over.” The new news quants “bring their own data” and represent a refreshing trend in media toward accountability at least, if not total objectivity, away from rhetoric and anecdote. We need more people like them. Whether you agree or not, their kind — our kind — will proliferate.

Congrats to David, Patrick, Chris, Yahoo! News, and the entire Signal team for going out on a limb, taking significant heat for it, and correctly predicting 50 out of 51 states and an Obama victory nearly nine months prior to the election.

Footnotes

[1] Here was the day-before guest list for the February 15 Yahoo! press dinner, though one or two didn’t make it:
-  New York Times, John Markoff
-  New York Times, David Corcoran
-  Fast Company, EB Boyd
-  Forbes, Tomio Geron
-  MIT Tech Review, Tom Simonite
-  New Scientist, Jim Giles
-  Scobleizer, Robert Scoble
-  WIRED, Cade Metz
-  Bloomberg/BusinessWeek, Doug MacMillan
-  Reuters, Alexei Oreskovic
-  San Francisco Chronicle, James Temple

[2] The extended Signal cast included Kim Farrell, Kim Capps-Tanaka, Sebastien Lahaie, Miro Dudik, Patrick Hummel, Alex Jaimes, Ingemar Weber, Ana-Maria Popescu, Peter Mika, Rob Barrett, Thomas Kelly, Chris Suellentrop, Hillary Frey, EJ Lao, Steve Enders, Grant Wong, Paula McMahon, Shirish Anand, Laura Davis, Mridul Muralidharan, Navneet Nair, Arun Kumar, Shrikant Naidu, and Sudar Muthu.

[3] Although I continue to be amazed at how greener the grass is at Microsoft compared to Yahoo!, my one significant regret is not being able to see The Signal project through to its natural conclusion. Although The Signal blog was by no means the sole product of the project, it was certainly the hub. In the end, I wrote 22 articles and David Rothschild at least three times that many.

Yahoo! Key Scientific Challenges: Applications due March 11

Applications for Yahoo!’s third annual Key Scientific Challenges Program are due March 11. Our goal is to support students working in areas we feel represent the future of the Internet. If you’re a Ph.D. student working in one of the areas below, please apply!

We are thrilled to announce Yahoo!’s third annual Key Scientific Challenges Program. This is your chance to get an inside look at — and help tackle — the big challenges that Yahoo! and the entire Internet industry are facing today. As part of the Key Scientific Challenges Program you’ll gain access to Yahoo!’s world-class scientists, some of the richest and largest data repositories in the world, and have the potential to make a huge impact on the future of the Internet while driving your research forward.

THE CHALLENGES AREAS INCLUDE:

– Search Experiences
– Machine Learning
– Data Management
– Information Extraction
– Economics
– Statistics
– Multimedia
– Computational Advertising
– Social Sciences
– Green Computing
– Security
– Privacy

KEY SCIENTIFIC CHALLENGES AWARD RECIPIENTS RECEIVE:

– $5,000 unrestricted research seed funding which can be used for conference fees and travel, lab materials, professional society membership dues, etc.

– Access to select Yahoo! datasets

– The unique opportunity to collaborate with our industry-leading scientists

– An invitation to this summer’s exclusive Key Scientific Challenges Graduate Student Summit where you’ll join the top minds in academia and industry to present your work, discuss research trends and jointly develop revolutionary approaches to fundamental problems

CRITERIA: To be eligible, you must be currently enrolled in a PhD program at any accredited institution.

We’re accepting applications from January 24th – March 11th, 2011 and winners will be announced by mid April 2011.

To learn more about the program and how to apply, visit http://labs.yahoo.com/ksc.

wise.gov: NSF and IARPA funding for collective intelligence

The US National Science Foundation’s Small Business Innovation Research program provides grants to to small businesses to fund “state-of-the-art, high-risk, high-potential innovation research proposals”.

In their current call for proposals, they explicitly ask for “I2b. Tools for facilitating collective intelligence”.

These are grants of up to US$150,000 with opportunity for more later I believe. The deadline is December 3, 2010! Good luck and (not so) happy Thanksgiving to anyone working on one of these proposals. I’m glad to help if I can.


The deadline for another US government program has passed, but should yield interesting results and may lead to future opportunities. In August, the Intelligence Advanced Research Projects Activity (IARPA, the intelligence community’s DARPA), which “invests in high-risk/high-payoff research programs” in military intelligence, solicited proposals for Aggregative Contingent Estimation, or what might be called wisdom-of-crowds methods for prediction:

The ACE Program seeks technical innovations in the following areas:

  • Efficient elicitation of probabilistic judgments, including conditional probabilities for contingent events.
  • Mathematical aggregation of judgments by many individuals, based on factors that may include past performance, expertise, cognitive style, metaknowledge, and other attributes predictive of accuracy.
  • Effective representation of aggregated probabilistic forecasts and their distributions.

The full announcement is clear, detailed, and well thought out. I was impressed with the solicitors’ grasp of research in the field, an impression no doubt bolstered by the fact that some of my own papers are cited 😉 . Huge hat tip to Dan Goldstein for collating these excerpts:

The accuracy of two such methods, unweighted linear opinion pools and conventional prediction markets, has proven difficult to beat across a variety of domains.2 However, recent research suggests that it is possible to outperform these methods by using data about forecasters to weight their judgments. Some methods that have shown promise include weighting forecasters’ judgments by their level of risk aversion, cognitive style, variance in judgment, past performance, and predictions of other forecasters’ knowledge.3 Other data about forecasters may be predictive of aggregate accuracy, such as their education, experience, and cognitive diversity. To date, however, no research has optimized aggregation methods using detailed data about large numbers of forecasters and their judgments. In addition, little research has tested methods for generating conditional forecasts.

2 See, e.g., Tetlock PE, Expert Political Judgment (Princeton, NJ: Princeton University Press, 2005), 164-88; Armstrong JS, “Combining Forecasts,” in JS Armstrong, ed., Principles of Forecasting (Norwell, MA: Kluwer, 2001), 417-39; Arrow KJ, et al., “The Promise of Prediction Markets,” Science 2008; 320: 877-8; Chen Y, et al., “Information Markets Vs. Opinion Pools: An Empirical Comparison,” Proceedings of the 6th ACM Conference on Electronic Commerce, Vancouver BC, Canada, 2005.

3 See, e.g., Dani V, et al., “An empirical comparison of algorithms for aggregating expert predictions,” Proc. 22nd Conference on Uncertainty in Artificial Intelligence, UAI, 2006; Cooke RM, ElSaadany S, Huang X, “On the performance of social network and likelihood-based expert weighting schemes,” Reliability Engineering and System Safety 2008; 93:745-756; Ranjan R, Gneiting T, “Combining probability forecasts,” Journal of the Royal Statistical Society: Series B (Statistical Methodology) 2010; 72(1): 71-91.

[Examples:]

  • Will the incumbent party win the next presidential election in Country X?
  • Will the incumbent party win the next presidential election in Country X?
  • When will Country X hold its next parliamentary elections?
  • How many cell phones will be in use globally by 12/31/11?
  • By how much will the GDP of Country X increase from 1/1/11 to 12/31/11?
  • Will Country X default on its sovereign debt in 2011?
  • If Country X defaults on its sovereign debt in 2011, what will be the growth rate in the Eurozone in 2012?

Elicitation – Advances Sought
The ACE Program seeks methods to elicit judgments from individual forecasters on:

  • Whether an event will or will not occur
  • When an event will occur
  • The magnitude of an event
  • All of the above, conditioned on another set of events or actions
  • The confidence or likelihood a forecaster assigns to his or her judgment
  • The forecaster’s rationale for his or her judgment, as well as links to background information or evidence, expressed in no more than a couple of lines of text
  • The forecaster’s updated judgments and rationale

The elicitation methods should allow prioritization of elicitations, continuous updating of forecaster judgments and rationales, and asynchronous elicitation of judgments from more than 1,000 geographically-dispersed forecasters. While aggregation methods, detailed below, should be capable of generating probabilities, the judgments elicited from forecasters can but need not include probabilities.

Challenges include:

  • Some forecasters will be unaccustomed to providing probabilistic judgments
  • There has been virtually no research on methods to elicit conditional forecasts
  • Elicitation should require a minimum of time and effort from forecasters; elicitation should require no more than a few minutes per elicitation per forecaster
  • Training time for forecasters will be limited, and all training must be delivered within the software
  • Rewards for participation, accuracy, and reasoning must be non-monetary and of negligible face value (e.g., certificates, medals, pins)

Book of Odds is serious fun

In the Book of Odds, you can find everything from the odds an astronaut is divorced (1 in 15.54) to the odds of dying in a freak vending machine accident (1 in 112,000,000).

Book of Odds is, in their own words, “the missing dictionary, one filled not with words, but with numbers – the odds of everyday life.”

I use their words because, frankly I can’t say it better. The creators are serious wordsmiths. Their name itself is no exception. “Book of Odds” strikes the perfect chord: memorable and descriptive with a balance of authority and levity. On the site you can find plenty of amusing odds about sex, sports, and death, but also odds about health and life that make you think, as you compare the relative odds of various outcomes. Serious yet fun, in the grand tradition of the web.

I love their mission statement. They seek both to change the world — by establishing a reliable, trustworthy, and enduring new reference source — and to improve the world — by educating the public about probability, uncertainty, and decision making.

By “odds”, they do not mean predictions.

Book of Odds is not in the business of predicting the future. We are far too humble for that…

Odds Statements are based on recorded past occurrences among a large group of people. They do not pretend to describe the specific risk to a particular individual, and as such cannot be used to make personal predictions.

In other words, they report how often some property occurs among a group of people, for example the fraction all deaths caused by vending machines, not how likely you, or anyone in particular, are to die at the hands of a vending machine. Presumably if you don’t grow enraged at uncooperative vending machines or shake them wildly, you’re safer than the 1 in 112,000,000 stated odds. A less ambiguous (but clunky) name for the site would be “Book of Frequencies”.

Sometimes the site’s original articles are careful about this distinction between frequencies and predictions but other times less so. For example, this article says that your odds of becoming the next American Idol are 1 in 103,000. But of course the raw frequency (1/number-of-contestants) isn’t the right measure: your true odds depend on whether you can sing.

Their statement of What Book of Odds isn’t is refreshing:

Book of Odds is not a search-engine, decision-engine, knowledge-engine, or any other kind of engine…so please don’t compare us to Googleâ„¢. We did consider the term “probability engine” for about 25 seconds, before coming to our senses…

Book of Odds is never finished. Every day new questions are asked that we cannot yet answer…

A major question is whether consumers want frequencies, or if they want predictions. If I had to guess, I’d (predictably) say predictions — witness Nate Silver and Paul the Octopus. (I’ve mused about using *.oddhead.com to aggregate predictions from around the web.)

The site seems in need of some SEO. The odds landing pages, like this one, don’t seem to be comprehensively indexed in Bing or Google. I believe this is because there is no natural way for users (and thus spiders) to browse (crawl) them. (Is this is a conscious choice to protect their data? I don’t think so: the landing pages have great SEO-friendly URLs and titles.) The problem is exacerbated because Book of Odds own custom search is respectable but, inevitably, weaker than what we’ve become accustomed to from the major search engines.

Book of Odds launched in 2009 with a group of talented and well pedigreed founders and a surprisingly large staff. They’ve made impressive strides since, adding polls, a Yahoo! Application, an iGoogle gadget, regular original content, and a cool visual browser that, like all visual browsers, is fun but not terribly useful. They’ve won a number of awards already, including “most likely company to be a household name in five years”. That’s a low-frequency event, though Book of Odds may beat the odds. Or have some serious fun trying.

Computer science = STEAM

At a recent meeting of the Association for Computing Machinery, the main computer science association, the CEO of ACM John White reported on efforts to increase the visibility and understanding of computer science as a discipline. He asked “Where is the C in STEM?” (STEM stands for Science, Technology, Engineering, and Math, and there are many policy efforts to promote teaching and learning in these areas.) He argued that computer science is not just the “T” in “STEM”, as many might assume. Computer science deserves attention of its own from policy makers, teachers, and students.

I agree, but if computer science is not the “T”, then what is it? It’s funny. Computer science seems to span all the letters of STEM. It’s part science, part technology, part engineering, and part math. (Ironically, even though it’s called computer science, the “S” may be the least defensible.*)

The interdisciplinary nature of computer science can be seen throughout the university system: no one knows quite where CS departments belong. At some universities they are part of engineering schools, at others they belong to schools of arts and sciences, and at still others they have moved from one school to another. That’s not to mention the information schools and business schools with heavy computer science focus. At some universities, computer science is its own school with its own Dean. (This may be the best solution.)

Actually, I’d go one step further and say that computer science also involves a good deal of “A”, or art, as Paul Graham popularized in his wonderful book Hackers and Painters, and as seen most clearly in places like the MIT Media Lab and the NYU Interactive Telecommunications Program.

So where is the C in STEM? Everywhere. Plus A. Computer science = STEAM.**

__________
* It seems that those fields who feel compelled to append the word “science” to their names (social science, political science, library science) are not particularly scientific.
** Thanks to Lance Fortnow for contributing ideas for this post, including the acronym STEAM.

Upcoming CS-econ events: New York Computer Science and Economics Day and ACM Conference on Electronic Commerce

1. New York Computer Science and Economics Day (NYCE Day)

Monday, November 9, 2009 | 9:00 AM – 5:00 PM
The New York Academy of Sciences, New York, NY, USA

NYCE 2009 is the Second Annual New York Computer Science and Economics Day. The goal of the meeting is to bring together researchers in the larger New York metropolitan area with interests in Computer Science, Economics, Marketing and Business and a common focus in understanding and developing the economics of internet activity. Examples of topics of interest include theoretical, modeling, algorithmic and empirical work on advertising and marketing based on search, user-generated content, or social networks, and other means of monetizing the internet.

The workshop is soliciting rump session speakers until October 12. Rump session speakers will have 5 minutes to describe a problem and result, an experiment/system and results, or an open problem or a big challenge.

Invited Speakers

  • Larry Blume, Cornell University
  • Shahar Dobzinski, Cornell University
  • Michael Kearns, University of Pennsylvania
  • Jennifer Rexford, Princeton University

CFP: New York Computer Science and Economics Day (NYCE Day), Nov 9 2009

2. 11th ACM Conference on Electronic Commerce (EC’10)

June 7-11, 2010
Harvard University, Cambridge, MA, USA

Since 1999 the ACM Special Interest Group on Electronic Commerce (SIGecom) has sponsored the leading scientific conference on advances in theory, systems, and applications for electronic commerce. The Eleventh ACM Conference on Electronic Commerce (EC’10) will feature invited speakers, paper presentations, workshops, and tutorials covering all areas of electronic commerce. The natural focus of the conference is on computer science issues, but the conference is interdisciplinary in nature. The conference is soliciting full papers and workshop and tutorial proposals on all aspects of electronic commerce.

Psst: WeatherBill doesn’t know New Jersey is the new Florida: Place your bets now

Quantifying New York’s 2009 June gloom using WeatherBill and Wolfram|Alpha

In the northeastern United States, scars are slowly healing from a miserably rainy June — torturous, according to the New York Times. Status updates bemoaned “where’s the sun?”, “worst storm ever!”, “worst June ever!”. Torrential downpours came and went with Florida-like speed, turning gloom into doom: “here comes global warming”.

But how extreme was the month, really? Was our widespread misery justified quantitatively, or were we caught in our own self-indulgent Chris Harrisonism, “the most dramatic rose ceremony EVER!”.

This graphic shows that, as of June 20th, New York City was on track for near-record rainfall in inches. But that graphic, while pretty, is pretty static, and most people I heard complained about the number of days, not the volume of rain.

I wondered if I could use online tools to determine whether the number of rainy days in June was truly historic. My first thought was to try Wolfram|Alpha, a great excuse to play with the new math engine.

Wolfram|Alpha queries for “rain New Jersey June 200Y” are detailed and fascinating, showing temps, rain, cloud cover, humidity, and more, complete with graphs (hint: click “More”). But they don’t seem to directly answer how many days it rained at least some amount. The answer is displayed graphically but not numerically (the percentage and days of rain listed appears to be hours of rain divided by 24). Also, I didn’t see how to query multiple years at a time. So, in order to test whether 2009 was a record year, I would have to submit a separate query for each year (or bypass the web interface and use Mathematica directly). Still, Wolfram|Alpha does confirm that it rained 3.8 times as many hours in 2009 as 2008, already one of the wetter months on record.

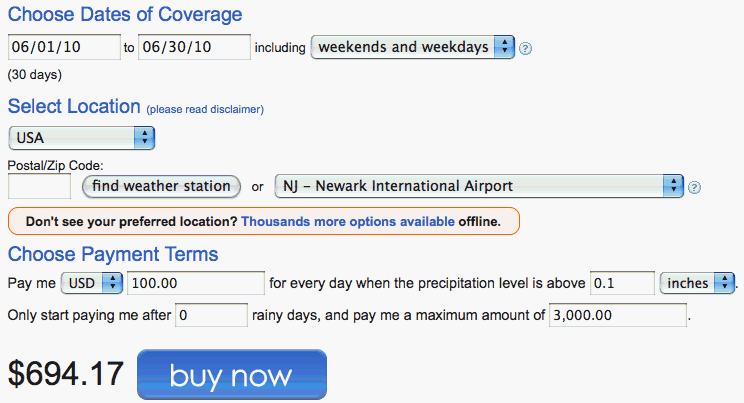
WeatherBill, an endlessly configurable weather insurance service, more directly provided what I was looking for on one page. I asked for a price quote for a contract paying me $100 for every day it rains at least 0.1 inches in Newark, NJ during June 2010. It instantly spat back a price: $694.17.


WeatherBill rainy day contract for June 2010 in Newark, NJ

It also reported how much the contract would have paid — the number of rainy days times $100 — every year from 1979 to 2008, on average $620 for 6.2 days. It said I could “expect” (meaning one standard deviation, or 68% confidence interval) between 3.9 and 8.5 days of rain in a typical year. (The difference between the average and the price is further confirmation that WeatherBill charges a 10% premium.)

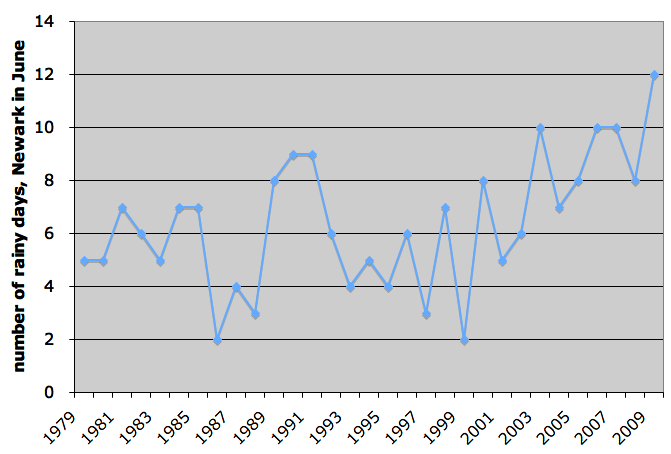
Below is a plot of June rainy days in Newark, NJ from 1979 to 2009. (WeatherBill doesn’t yet report June 2009 data so I entered 12 as a conservative estimate based on info from Weather Underground.)


Number of rainy days in Newark, NJ from 1979-2009

Indeed, our gloominess was justified: it rained in Newark more days in June 2009 than any other June dating back to 1979.

Intriguingly, our doominess may have been justified too. You don’t have to be a chartist to see an upward trend in rainy days over the past decade.

WeatherBill seems to assume as a baseline that past years are independent unbiased estimates of future years — usually not a bad assumption when it comes to weather. Still, if you believe the trend of increasing rain is real, either due to global warming or something else, WeatherBill offers a temptingly good bet. At $694.17, the contract (paying $100 per rainy day) would have earned a profit in 7 of the last 7 years. The chance of that streak being a coincidence is less than 1%.

If anyone places this bet, let me know. I would love to, but as of now I’m roughly $10 million in net worth short of qualifying as a WeatherBill trader.

The long tail of science: Good, bad, or ugly?

(First in a series of “random thoughts on science”)

A mind boggling number of academic research conferences and workshops take place every year. Each fills a thick proceedings with publications, some containing hundreds of papers. High-profile conferences can attract five times that many submissions, often of low average quality. Smaller venues can seem absurdly specialized (unless it happens to be your specialty). Every year, new venues emerge. Once established, rarely do they “retire” (there is still an ACM Special Interest Group on the Ada programming language, in addition to a SIG on programming languages). It’s impossible for all or even most of the papers published in a given year to be impactful. Most of them, including plenty of my own, will never be cited or even read by more than the authors and reviewers.

No one can deny that incredible breakthroughs emerge from the scientific process — from Einstein to Shannon to Turing to von Neumann — but scientific output seems to have a (very) long tail.

Is this a good thing, a bad thing, or just a thing?

Is the tail…

Good?
Is the tail actually crucial to the scientific process? Are some breakthroughs the result of ideas that percolate through long chains — person to person, paper to paper — from the bottom up? Is science less dwarfs standing on the shoulders of giants than giants standing on the shoulders of dwarfs? I published a fairly straightforward paper that applies results in social choice theory to collaborative filtering. Then a smarter scientist wrote a better paper on a more widely applicable subject, apparently partially inspired by our approach. Could such virtuous chains actually lead, eventually, to the truly revolutionary discoveries? Is the tail wagging the dog?
Bad?
Are the papers in the tail a waste of time, energy, and taxpayer dollars? Do they have virtually no impact, at least compared to their cost? Should we try hard to find objective measures that identify good science and good scientists and target our funding to them, starving out the rest?
Ugly?
Is the tail simply a messy but necessary byproduct (I can’t resist: a “messessity”) of the scientific process? Under this scenario, breakthroughs are fundamentally rare and unpredictable hits among an enormous sea of misses. To get more and better breakthroughs, we need more people trying and mostly failing — more monkeys at typewriters trying to bang out Shakespeare. Every social system, indeed almost every natural system, has a long tail. Maybe it’s simply unavoidable, even if it isn’t pretty. Was the dog simply born with its (long and scraggly) tail attached?