Category Archives: computer science

Death in artificial intelligence

Until just reading about it in Wired, I knew little1 of the apparent suicide of Push Singh, a rising star in the field of artificial intelligence.

Singh seemed to have everything going for him: brilliant and driven, he became the protégé of his childhood hero Marvin Minsky, eventually earning a faculty position alongside him at MIT. Professionally, Singh earned praise from everyone from IEEE Intelligent Systems, who named Singh one of AI’s Ten to Watch (apparently revised), to Bill Gates, who asked Singh to keep him appraised of his latest publications. Singh’s social life seemed healthy and happy. The article struggles to uncover a hint of why Singh would take his own life, mentioning his excruciating chronic back pain (and linking it to a passage on the evolutionary explanation of pain as “programming bug” in Minsky’s new book, a book partly inspired by Singh).

The article weaves Push’s story with the remarkable parallel life and death of Chris McKinstry, a man with similar lofty goals of solving general AI, and even a similar approach of eliciting common sense facts from the public. (McKinstry’s Mindpixel predated Singh’s OpenMind initiative.) McKinstry’s path was less socially revered, and he seemed on a never ending and aching quest for credibility. The article muses whether there might be some direct or indirect correlation between the eerily similar suicides of the two men, even down to their methods.

For me, the story felt especially poignant, as growing up I was nourished on nearly the same computer geek diet as Singh: Vic 20, Apple II, Star Trek, D&D, HAL 9000, etc. In Singh I saw a smarter and more determined version of myself. Like many, I dreamt of solved AI, and of solving AI, even at one point wondering if a neural network trained on yes/no questions might suffice, the framework proposed by McKinstry. My Ph.D. is in artificial intelligence, though like most AI researchers my work is far removed from the quest for general AI. Over the years, I’ve become at once disillusioned with the dream2 and, hypocritically, upset that so many in the field have abandoned the dream in pursuit of a fractured set of niche problems with questionable relevance to whole.

Increasingly, researchers are calling for a return to the grand challenge of general AI. It’s sad that Singh, one of the few people with a legitimate shot at leading the way, is now gone.

Push Singh Memorial Fund

1Apparently details about Singh’s death have been slow to emerge, with MIT staying mostly quiet, for example not discussing the cause of death and taking down a memorial wiki built for Singh.
1 My colleague Fei Sha, a new father, put it nicely, saying he is “constantly amazed by the abilities of children to learn and adapt and is losing bit by bit his confidence in the romantic notion of artificial intelligence”.

Search engine futures!

I am happy to report that on my suggestion intrade has listed futures contracts for 2008 search engine market share.

Here is how they work:

A contract will expire according to the percentage share of internet searches conducted in the United States in 2008. For example, if 53.5% of searches conducted in the United States in 2008 are made using Google then the contract listed for Google will expire at 53.5…

…Expiry will be based on the United States search share rankings published by Nielson Online.

I think this could be a fascinating market because:

  • Search engine market share is very important to these major companies, with dramatic effects on their share prices.
  • Search engine market share is fluid, so far with Google growing inexorably. However, Microsoft has cash, determination, Internet Explorer, and the willingness to experiment. Ask.com has erasers, 3D, ad budgets, and The Algorithm. Yahoo!, second in market share, often tests equal or better than Google, and new features like Search Assist are impressive.
  • The media loves to write about it.
  • A major search company might use the market to hedge. Well, this seems far-fetched but you never know. Certainly, from an economic risk management standpoint it would seem to make a great deal of sense. (Here, as always on this blog, I speak on behalf of myself and not my company.)

Finally, I have to comment on how refreshingly easy the process was in working with intrade. They went from suggestion to implementation in a matter of days. It’s a shame that US-based companies are in contrast stuck in stultifying legal and regulatory mud.

Addendum 2008/01/26: Here are links to some market research reports:
Nielsen | ComScore | HitWise | Compete

(It seems that Nielsen Netratings homepage is down; getting 404 error at the moment)

Addendum 2008/03/07: If you prefer, you can now also bet on search share just for fun with virtual currency at play.intrade.com.

(Nielsen Netratings homepage is still down, now for over a month. It’s even more ridiculous given that their own Nielsen Online website points to this page.)

Checkers bot can't lose… Ever

Mathematicians, third graders, and talkative defense department computers alike all know that there is an infallible way to play tic tac toe. A competent player can always force at least a tie against even the most savvy opponent.

In the July issue of Science, artificial intelligence researchers from the University of Alberta announced they had cracked the venerable game of checkers in the same way, identifying an infallible strategy that cannot lose.1

It doesn’t matter if the strategy is unleashed against a bumbling novice or a flawless grandmaster, it can always eke out at least a tie if not a win. In other words, any player adopting the strategy (a computer, say) makes for the most flawlessy grandmasterest checkers player of all time, period.

The proof of correctness is a computational proof that took six years to complete and was twenty-seven years in the making.

Tic tac toe and checkers are examples of deterministic games that do not involve dice, cards, or any other randomizing element, and so “leave nothing to chance”. In principle, every deterministic game, including chess, has a best possible guaranteed outcome2 and a strategy that will unfailingly obtain it. For chess, even though we know that an optimal strategy exists, the game is simply too complex for any kind of proof — by person or machine — to unearth it as of yet.

The UofA team’s accomplishment is significant, marking a major milestone in artificial intelligence research. Checkers is probably the first serious, popular game with a centuries-long history of human play to be solved, and certainly the most complex game solved to date.

Next stop: Poker

Meanwhile, the UofA’s poker research group is building Poki, a computer player for Texas Hold’em poker. Because shuffling adds an element of chance, poker cannot be solved for an infallible strategy in the same way as chess or checkers, but it can in principal still be solved for an expected-best strategy. Although no one is anywhere near solving poker, Poki is probably the world’s best poker bot. (A CMU team is also making great strides.)

Poki’s legitimate commercial incarnation is Poker Academy, a software poker tutor. An unauthorized hack of Poker Academy [original site taken down; see 2006 archive.org copy] may live an underground life as a mechanical shark in online poker rooms. (Poki’s creators have pledged not to use their bot online unidentified.)

Poker web sites take great pains to weed out bots — or at least take great pains to appear to be weeding out bots. Then again, some bot runners take great pains to avoid detection. This is a battle the poker web sites cannot possibly win.

1Technically, tic tac toe is “strongly solved”, meaning that the best strategy is known starting from every game position, while the UofA team succeeded in “weakly solving” checkers, meaning that they found a best strategy starting from the initial game board configuration.
2The best possible guaranteed outcome is the best outcome that can always be assured, no matter how good the opponent.

Predicting media success

Often, predicting success is being a success. Witness Sequoia Capital or Warren Buffet.

In the media industry (e.g., books, celebs, movies, music, tv, web), predicting success largely boils down to predicting popularity.

Predicting popularity would be wonderfully easy, if it weren’t for one inconvenient truth: people herd. If only people were as fiercely independent as they sometimes claim to be — if everyone decided what they liked independently, without regard to what others said — then polling would be the only technology we would need. A small audience poll would foreshadow popularity with high accuracy.

Alas, such is not the case. No one consumes media in a vacuum. People are persuaded by influencers and influenced by persuaders. People respond in whole or in part to the counsel of critics, peers, viruses, and (yes) advertisers. So, what becomes popular is not simply a matter of what is good. What becomes popular depends on a complex dynamic process of spreading influence that’s hard to track and even harder to predict.

Columbia sociologist (and I’m happy to note future Yahoo) Duncan Watts and his colleagues conducted an artful studydescribed eloquently in the NY Times — asking just how much of media success reflects the true quality of the product, and how much is due to the quirks of social influence. In a series of carefully controlled experiments, the authors tease apart two distinct factors in a song’s ultimate success: (1) the inherent quality of the song, or the degree people like the song if presented it in isolation, and (2) dumb luck, or the extent the song happens by chance to get some of the best early buzz, snowballing it to the top of the charts in a self-fulfilling prophesy. Lo and behold, they found that, while inherent quality does matter, the luck of the draw plays at least as big a role in determining a song’s ultimate success.

If so, Big Media might be forgiven for their notoriously poor record of picking winners. Over and over, BM hoists on us stinkers like Gigli and stale knockoffs like Treasure Hunters. (In prediction lingo, these are false positives.) At the same time, BM snubbed (at least initially) some cultural institutions like Star Wars and Seinfeld. (False negatives.)

So, are media executives making the best of a bad situation, eking out as much signal as possible from an inherently noisy process? Or might some other institution yield forecasts with fewer false-atives?

I think you know where this is going. Prediction markets for media!

Media Predict is exactly that: a new prediction market aimed at forecasting media success. I’d like to congratulate founder Brent Stinski on a spectacular launch done right. Media Predict sprinted out of the gates with a deal with Simon & Schuster’s Touchstone Books and a companion piece in the NY Times, spawning coverage in The Economist and NPR. (Also congrats to Inkling Markets, the “powered by” provider.) More importantly, the website is clean, clear, complete (enough), and ready for launch.

I first met Brent Stinski in 2006 at Collabria’s NYC Prediction Markets Summit and his concept impressed me. Among the flury of recent play money PM startups, Media Predict’s business plan seems one of the most credible. The site taps simultaneously into the wisdom of crowds ethos, the user-generated content explosion, artists’ anti-establishment streak, and the public’s ambivalence toward Big Media. (The latter two factors are epitomized no more vehemently and eloquently than in an essay by Courtney Love, and stoke the fires of sites like Garage Band, Magnatune, Creative Commons, Lulu, Kinooga, and even MySpace, not to mention mashup fever, open source, anti-DRM-ism, etc.)

The New York publishing world is ridiculing Simon & Schuster for ceding its editorial power to the crowd. (In fact, S&S reserves the right to choose any book or none at all.)

Time will tell whether prediction markets can be better than (or at least more cost effective than) traditional media executives. One thing is for certain: one way or another, the power structure in the publishing world is changing rapidly and dramatically (no one sees and explains this better than Tim O’Reilly). My bet is that many artists and consumers will emerge feeling better than ever.

The wisdom of the ProbabilitySports crowd

One of the purest and most fascinating examples of the “wisdom of crowds” in action comes courtesy of a unique online contest called ProbabilitySports run by mathematician Brian Galebach.

In the contest, each participant states how likely she thinks it is that a team will win a particular sporting event. For example, one contestant may give the Steelers a 62% chance of defeating the Seahawks on a given day; another may say that the Steelers have only a 44% chance of winning. Thousands of contestants give probability judgments for hundreds of events: for example, in 2004, 2,231 ProbabilityFootball participants each recorded probabilities for 267 US NFL Football games (15-16 games a week for 17 weeks).

An important aspect of the contest is that participants earn points according to the quadratic scoring rule, a scoring method designed to reward accurate probability judgments (participants maximize their expected score by reporting their best probability judgments). This makes ProbabilitySports one of the largest collections of incentivized1 probability judgments, an extremely interesting and valuable dataset from a research perspective.

The first striking aspect of this dataset is that most individual participants are very poor predictors. In 2004, the best score was 3747. Yet the average score was an abysmal -944 points, and the median score was -275. In fact, 1,298 out of 2,231 participants scored below zero. To put this in perspective, a hypothetical participant who does no work and always records the default prediction of “50% chance” for every team receives a score of 0. Almost 60% of the participants actually did worse than this by trying to be clever.

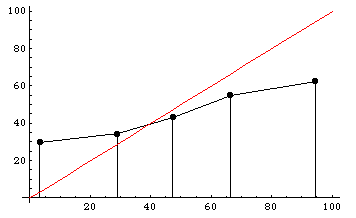
ProbabilitySports participants' calibrationParticipants are also poorly calibrated. To the right is a histogram dividing participants’ predictions into five regions: 0-20%, 20-40%, 40-60%, 60-80%, and 80-100%. The y-axis shows the actual winning percentages of NFL teams within each region. Calibrated predictions would fall roughly along the x=y diagonal line, shown in red. As you can see, participants tended to voice much more extreme predictions than they should have: teams that they said had a less than 20% chance of winning actually won almost 30% of the time, and teams that they said had a greater than 80% chance of winning actually won only about 60% of the time.

Yet something astonishing happens when we average together all of these participants’ poor and miscalibrated predictions. The “average predictor”, who simply reports the average of everyone else’s predictions as its own prediction, scores 3371 points, good enough to finish in 7th place out of 2,231 participants! (A similar effect can be seen in the 2003 ProbabilityFootball dataset as reported by Chen et al. and Servan-Schreiber et al.)

Even when we average together the very worst participants — those participants who actually scored below zero in the contest — the resulting predictions are amazingly good. This “average of bad predictors” scores an incredible 2717 points (ranking in 62nd place overall), far outstripping any of the individuals contributing to the average (the best of whom finished in 934th place), prompting someone in this audience to call the effect the “wisdom of fools”. The only explanation is that, although all these individuals are clearly prone to error, somehow their errors are roughly independent and so cancel each other out when averaged together.

Daniel Reeves and I follow up with a companion post on Robin Hanson’s OvercomingBias forum with some advice on how predictors can improve their probability judgments by averaging their own estimates with one or more others’ estimates.

In a related paper, Dani et al. search for an aggregation algorithm that reliably outperforms the simple average, with modest success.

     1Actually the incentives aren’t quite ideal even in the ProbabilitySports contest, because only the top few competitors at the end of each week and each season win prizes. Participants’ optimal strategy in this all-or-nothing type of contest is not to maximize their expected score, but rather to maximize their expected prize money, a subtle but real difference that tends to induce greater risk taking, as Steven Levitt describes well. (It doesn’t matter whether participants finish in last place or just behind the winners, so anyone within striking distance might as well risk a huge drop in score for a small chance of vaulting into one of the winning positions.) Nonetheless, Wolfers and Zitzewitz show that, given the ProbabilitySports contest setup, maximizing expected prize money instead of expected score leads to only about a 1% difference in participants’ optimal probability reports.

Evaluating probabilistic predictions

A number of naysayers [Daily Kos, The Register, The Big Picture, Reason] are discrediting prediction markets, latching onto the fact that markets like TradeSports and NewsFutures failed to call this year’s Democratic takeover of the US Senate. Their critiques reflect a clear misunderstanding of the nature of probabilistic predictions, as many others [Emile, Lance] have pointed out. Their misunderstanding is perhaps not so surprising. Evaluating probabilistic predictions is a subtle and complex endeavor, and in fact there is no absolute right way to do it. This fact may pose a barrier for the average person to understand and trust (probabilistic) prediction market forecasts.

In an excellent article in The New Republic Online [full text], Bo Cowgill and Cass Sunstein describe in clear and straightforward language the fallacy that many people seem to have made, interpreting a probabilistic prediction like “Democrats have a 25% chance of winning the Senate” as a categorical prediction “The Democrats will not win the Senate”. Cowgill and Sunstein explain the right way to interpret probabilistic predictions:

If you look at the set of outcomes estimated to be 80 percent likely, about 80 percent of them [should happen]; events estimated to be 70 percent likely [should] happen about 70 percent of the time; and so on. This is what it means to say that prediction markets supply accurate probabilities.

Technically, what Cowgill and Sunstein describe is called the calibration test. The truth is that the calibration test is a necessary test of prediction accuracy, but not a sufficient test. In other words, for a predictor to be considered good it must pass the calibration test, but at the same time some very poor or useless predictors may also pass the calibration test. Often a stronger test is needed to truly evaluate the accuracy of probabilistic predictions.

For example, suppose that a meteorologist predicts the probability of rain every day. Now suppose this meteorologist is lazy and he predicts the same probability every day: he simply predicts the annual average frequency of rain in his location. He doesn’t ever look at cloud cover, temperature, satellite imagery, computer models, or even whether it rained the day before. Clearly, this meteorologist’s predictions would be uninformative and nearly useless. However, over the course of a year, this meteorologist would perform very well according to the calibration test. Assume it rains on average 10% of the time in the meteorologist’s city, so he predicts “10% chance” every day. If we test his calibration, we find that, among all the days he predicted a 10% chance of rain (i.e., every day), it actually rained about 10% of the time. This lazy meteorologist would get a nearly perfect score according to the calibration test. A hypothetical competing meteorologist who actually works hard to consider all variables and evidence, and who thus predicts different percentages on different days, could do no better in terms of calibration.

The above example suggests that good predictions are not just well calibrated: good predictions are, in some sense, both variable AND well calibrated. So what is the “right” way to evaluate probabilistic predictions? There is no single absolute best way, though several tests are appropriate, and probably can be considered stronger tests than the calibration test. In our paper “Does Money Matter?” we use four evaluation metrics:

  1. Absolute error: The average over many events of lose_PR, the probability assigned to the losing outcome(s)
  2. Mean squared error: The square root of the average of (lose_PR)2
  3. Quadratic score: The average of 100 – 400*(lose_PR)2
  4. Logarithmic score: The average of log(win_PR), where win_PR is the probability assigned to the winning outcome

Note that the absolute value of these metrics is not very meaningful. The metrics are useful only when comparing one predictor against another (e.g., a market against an expert).

My personal favorite (advocated in papers and presentations) is the logarithmic score. The logarithmic score is one of a family of so-called proper scoring rules designed so that an expert maximizes her expected score by truthfully reporting her probability judgment (the quadratic score is also a proper scoring rule). Stated another way, experts with more accurate probability judgments should be expected to accumulate higher scores on average. The logarithmic score is closely related to entropy: the negative of the logarithmic score gives the amount (in bits of information) that the expert is “surprised” by the actual outcome. Increases in logarithmic score can literally be interpreted as measuring information flow.

Actually, the task of evaluating probabilistic predictions is even trickier than I’ve described. Above, I said that a good predictor must at the very least pass the calibration test. Actually, that’s only true when the predicted events are statistically independent. It is possible for a perfectly valid predictor to appear miscalibrated when the events he or she is predicting are highly correlated, as discussed in a previous post.