Category Archives: blogging

A beautiful model (of the stock market)

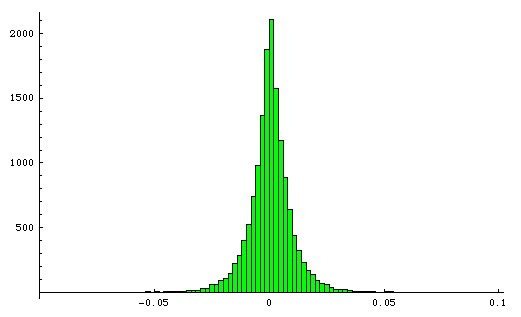
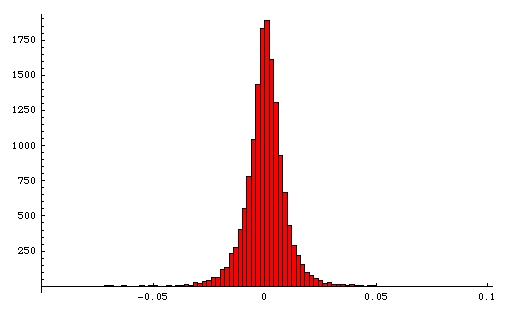
Here is a histogram of the daily changes of the S&P 500 from 1950 to 2009. The x-axis is the daily log difference* and the y-axis is the number of times that difference occurred.

Histogram of log differences of S&P500 from 1950 to 2009

It turns out that a Laplace distribution is a pretty good model of the stock market. The Laplace distribution is parametrized by its median u and its average absolute difference from median b. I computed these two parameters for the S&P 500 data and plugged them into a Laplace distribution in Mathematica, then used that to generate 59 years worth of random simulated S&P 500 prices. Here is the resulting histogram.

Histogram of log differences of simulated S&P500

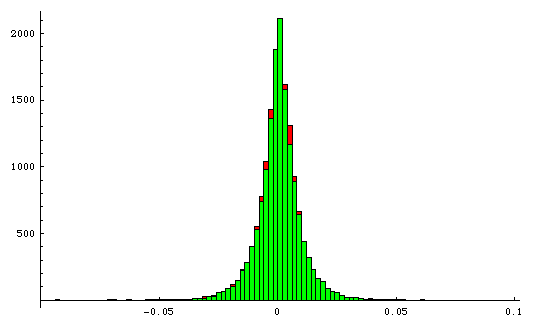
This is not a best fit: this is simply the same u and b computed on the data and then plugged into the distribution. Here are the two histograms on top of each other.

Histogram of log differences of S&P500 from 1950 to 2009 and simulated S&P 500

At the aggregate level the stock market is well behaved: it’s randomness is remarkably predictable. It’s amazing that this social construct — created by people for people, and itself often personified — behaves so much like a physical process, more so than any other man-made entity I can think of.

The graphs also hint at the futility of attaching reasons to price movements every single day. Today, “the prospects for continued low borrowing costs buoyed investors’ hopes for the U.S. economy”. Tomorrow, there may be “profit taking”.** Why do reporters feel obligated to explain why, or more to the point why do readers demand to be told? Why must we infer reasons, see momentum where there may be none, and assign labels like bull and bear? Why can’t we accept randomness?***

Update: Anthony Towns conducted a fascinating and puzzling follow-up analysis showing that the volatility of the stock market has been going up steadily over the years, even though the mean return has not.
__________
* The log difference is the log of the price on day d minus the log of the price on day d-1, or equivalently ln(d/(d-1)).
** I’d love to see a controlled experiment where financial reporters are given randomized reports about the Dow and watch them manufacture explanations, I imagine occasionally invoking the same cause for both ups and downs… (a) The prospect of higher interest rates spooked investors today; or (b) the Fed’s willingness to raise rates signals a recovering economy — investors rejoiced.
*** Let me clarify. The efficient market hypothesis implies both randomness and rationality: Randomness in the sense of statistical independence (no momentum), and rationality in the sense that price changes reflect new information. So I’m not saying that prices change for no reason, just that there is rarely an easily-stated single explanation for the overall market. (BTW, “profit taking” is never a valid explanation under EMH.)

Let the madness begin

Sixty-five men’s college basketball teams have been selected. Tomorrow there will be sixty-four. Half of the remaining teams will be eliminated twice every weekend for the next three weekends until only one team remains.

On April 5th, we will know who is champion. In the meantime, it’s anybody’s guess: any of 9.2 quintillion things could in principle happen.

At Predictalot it’s your guess. Make almost any prediction you can think of, like Duke will win go further than both Kansas and Kentucky, or the Atlantic Coast will lose more games than the Big East. There’s even the alphabet challenge: you pick six letters that include among them the first letters of all four final-four teams.

Following Selection Sunday yesterday, the full range of prediction types are now enabled in Predictalot encompassing hundreds of millions of predictions about your favorite teams, conferences, and regions. Check it out. Place a prediction or just lurk to see whether the crowd thinks St. Mary’s is this year’s Cinderella.

Come join our mad science experiment where crowd wisdom meets basketball madness. We’ve had many ups and down already — for example sampling is way trickier than I naively assumed initially — and I’m sure there is more to come, but that’s part of what makes building things based on unsolved scientific questions fun. Read more about the technical details in my previous posts and on the Yahoo! Research website.

And for the best general-audience description of the game, see the Yahoo! corporate blog.

Update: Read about us on the New York Times and VentureBeat.

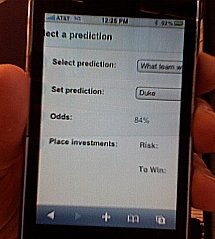
You can even get your fix on Safari on iPhone!

Dave playing Predictalot on iPhone

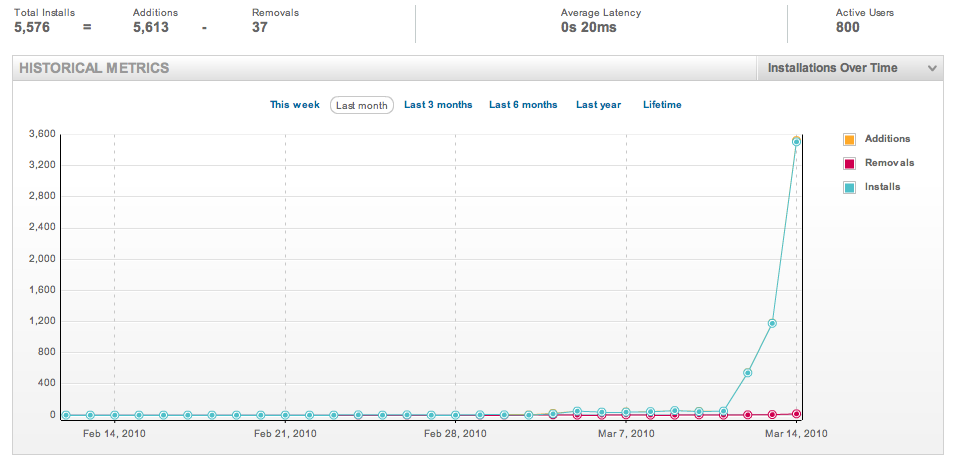
Below is a graph of our exponential user growth over the last couple days. Come join the stampede!

graph of YAP installs for Predictalot

Revisiting predictions: Google and Avatar

In September 2007 I predicted that “Google [will buy] a TV ad for Google.com aimed at mass consumers”… before September 2008. I only missed it by a year and a half.

In December, before Avatar was released and while some still thought it more likely to sink than swim, Slate journalist Josh Levin asked us to predict its opening weekend box office earnings using our models. We projected between $65 and $84 million. The actual number? $77 million.

Confession: In this post I am guilty of exactly the sins I’ve complained about in the past: cherry picking positive outcomes in hindsight, and measuring probabilistic predictions categorically and in isolation. Oops.

Computer science = STEAM

At a recent meeting of the Association for Computing Machinery, the main computer science association, the CEO of ACM John White reported on efforts to increase the visibility and understanding of computer science as a discipline. He asked “Where is the C in STEM?” (STEM stands for Science, Technology, Engineering, and Math, and there are many policy efforts to promote teaching and learning in these areas.) He argued that computer science is not just the “T” in “STEM”, as many might assume. Computer science deserves attention of its own from policy makers, teachers, and students.

I agree, but if computer science is not the “T”, then what is it? It’s funny. Computer science seems to span all the letters of STEM. It’s part science, part technology, part engineering, and part math. (Ironically, even though it’s called computer science, the “S” may be the least defensible.*)

The interdisciplinary nature of computer science can be seen throughout the university system: no one knows quite where CS departments belong. At some universities they are part of engineering schools, at others they belong to schools of arts and sciences, and at still others they have moved from one school to another. That’s not to mention the information schools and business schools with heavy computer science focus. At some universities, computer science is its own school with its own Dean. (This may be the best solution.)

Actually, I’d go one step further and say that computer science also involves a good deal of “A”, or art, as Paul Graham popularized in his wonderful book Hackers and Painters, and as seen most clearly in places like the MIT Media Lab and the NYU Interactive Telecommunications Program.

So where is the C in STEM? Everywhere. Plus A. Computer science = STEAM.**

__________
* It seems that those fields who feel compelled to append the word “science” to their names (social science, political science, library science) are not particularly scientific.
** Thanks to Lance Fortnow for contributing ideas for this post, including the acronym STEAM.

Why doesn’t Pittsburgh have a Silicon Hill?

I grew up in Pittsburgh. I love Pittsburgh. I still run into people who believe Pittsburgh is a steel town. Pittsburgh is not that — the steel industry cleared out (and the air cleared up) before I moved there at age 10 in 1981 — though driving through its streets it sometimes feels like one: gritty row houses, dive bars, old-growth neighborhoods, and independent shops, worn and welcoming.

Then what is Pittsburgh?

A sports town, no doubt, but that doesn’t count.

A hospital town, perhaps. The University of Pittsburgh Medical Center is a sprawling conglomerate of hospitals, doctors, researchers, and medical school, growing organically and through acquisition. Several other private hospitals and networks dot the city.

But with one the the top five computer science departments in the world at Carnegie Mellon University churning out grads at all levels, you might think Pittsburgh would have the seeds of a high-tech ecosystem. Yet there are few major technology companies, startups, or venture capital firms to nurture them locally. (Two exceptions I can think of: Google and CombineNet. Update: Also Intel Labs Pittsburgh.) Instead, CMU students tend to flee for the coasts after graduation.

Could Pittsburgh develop a startup row, a mini Silicon Valley? Pittsburghers have been hoping for and heralding such a transformation for decades. Given the city’s famously steep (SF-worthy) gradients, there’s even a perfect name for it: Silicon Hill.

In selecting Pittsburgh for the G-20 summit, the Obama administration cited Pittsburgh as a post-industrial success story with “renewed industries that are creating the jobs of the future”. But that seems very glass half full as (paraphrasing) one of my Pittsburgh friends noted on Facebook.

Paul Graham wrote a terrific essay (as Paul Graham is wont to do) about how a city might go about buying their own Silicon Valley.* He concludes that it may be possible. “For the price of a football stadium, any town that was decent to live in could make itself one of the biggest startup hubs in the world.” His main conjecture is that the money would fund a large number of good local startups in their infancy but without forcing them to stay — the best startups simply won’t take money that constrains their future options. The funding would have to be rich enough and the environment nice enough that they simply would not want to leave.

Is Graham right and, if so, could Pittsburgh pull it off?

__________
* See also Graham’s older and longer essay How to be Silicon Valley.

Countdown to web sentience

In 2003, we wrote a paper titled 1 billion pages = 1 million dollars? Mining the web to play Who Wants to be a Millionaire?. We trained a computer to answer questions from the then-hit game show by querying Google. We combined words from the questions with words from each answer in mildly clever ways, picking the question-answer pair with the most search results. For the most part (see below), it worked.

It was a classic example of “big data, shallow reasoning” and a sign of the times. Call it Google’s Law. With enough data nothing fancy can be done, but more importantly nothing fancy need be done: even simple algorithms can look brilliant. When in comes to, say, identifying synonyms, simple pattern matching across an enormous corpus of sentences beats the most sophisticated language models developed meticulously over decades of research.

Our Millionaire player was great at answering obscure and specific questions: the high-dollar questions toward the end of the show that people find difficult. It failed mostly on the warm-up questions that people find easy — the truly trivial trivia. The reason is simple. Factual answers like the year that Mozart was born appear all over web. Statements capturing common sense for the most part do not. Big data can only go so far.*

That was 2003.

In the paper, our clearest example of a question that we could not answer was How many legs does a fish have?. No one on the web would actually bother to write down the answer to that. Or would they?

I was recently explaining all this to a colleague. To make my point, we Googled that question. Lo and behold, there it was: asked and answered — verbatim — on Yahoo! Answers. How many legs does a fish have? Zero. Apparently Yahoo! Answers also knows the number of legs of a crayfish, rabbit, dog, starfish, mosquito, caterpillar, crab, mealworm, and “about 133,000” more.

Today, there are way more than 1 billion web pages: maybe closer to 1 trillion.

What’s the new lesson? Given enough time, everything will be on the web, including the fact that hungry poets blink (✓). Ok, not everything, but far more than anyone ever imagined.

It would be fun to try our Millionaire experiment again now that the web is bigger and search engines are smarter. Is there some kind of Moore’s Law for artificial intelligence as the web grows? Can sentience be far behind? 🙂

__________
* Lance agreed, predicting that IBM’s quest to build a Jeopardy-playing computer would succeed but not tell us much.

Predictalot! (And we mean alot)

I’m thrilled to announce the launch of Predictalot, a combinatorial prediction market for the NCAA Men’s Basketball playoffs. Predict almost anything you can think of, like Duke will advance further than UNC, or Every final four team name will start with U. Check the odds and invest points on your favorites. Sell your predictions anytime, even as you follow the basketball games live.

The basic game play is simple: select a prediction type, customize it, and invest points on it. Yet you’ll never run out of odds to explore: there are hundreds of millions of predictions you can make. The odds on each update continuously based on other players’ predictions and the on-court action.

Predictalot is a Yahoo! App, so you can play it at apps.yahoo.com or you can add it to your Yahoo! home page. I have to admit, it’s an incredible feeling to play a game I helped design right on the Yahoo! home page.

Predicalot app on the Yahoo! home page

That’s all you need to get started. If you’re curious and would like a peek under the hood, read on: there’s some interesting technology hidden in the engine.

Background and Details

Predictalot is a true combinatorial prediction market of the sort academics like us and Robin Hanson have been dreaming about since early in the decade. We built the first version during an internal Yahoo! Hack Day. Finally, we leveraged the Yahoo! Application Platform to quickly build a public version of the game. (Note that anyone can develop a YAP app that’s visible to millions — there’s good sample code, it supports YUI and OpenSocial, and it’s easy to get started.) After many fits and starts, late nights, and eventually all nights, we’re proud and excited to go live with Predictalot version 1.0. I can’t rave enough about the talent and dedication of the research engineers who gave the game a professional look and feel and production speed, turning a pie-in-the-sky idea into reality. We have many features and upgrades in mind for future versions, but the core functionality is in place and we hope you enjoy the game.

In the tournament, after the play-in game, the 64 top college basketball teams play 63 games in a single elimination tournament. So there are 2 to the power 63 or 9.2 quintillion total possible outcomes, or ways the entire tournament can unfold. Predictalot implicitly keeps track of the odds for them all. To put this in perspective, it’s estimated that there are about 10 quintillion individual insects on Earth. Of course, for all practical purposes, we can’t store 9.2 quintillion numbers, even with today’s computers. Instead, we compute the odds for any outcome on the fly by scanning through the predictions placed so far.

A prediction is a statement, like Duke will win in the first round, that will be either true or false in the final outcome. In this case, the prediction is true in exactly half, or 2 to the power 62 outcomes. (Note this does not mean the odds are 50% — remember the outcomes themselves are not all equally likely.) In theory, Predictalot can support predictions on any set of outcomes. That’s 2 to the power 2 to the power 63, or more than a googol predictions. For now, we restrict you to “only” hundreds of millions of predictions categorized into thirteen types. Computing the odds of a prediction precisely is too slow. Technically, the problem is #P-hard: as hard as counting SAT and harder than the travelling salesman problem. So we must resort to approximating the odds by randomly sampling the outcome space. Sampling is a tricky business — equal parts art and science — and we’re still actively exploring ways to increase the speed, stability, and accuracy of our sampling.

Because we track all possible outcomes, the predictions are automatically interconnected in ways you would expect. A large play on Duke to win the tournament instantly and automatically increases the odds of Duke winning in the first round; after all, Duke can’t win the whole thing without getting past the first round.

With 9.2 quintillion outcomes, Predictalot is to our knowledge the largest prediction market built, testing the limits of what the wisdom of crowds can produce. Predictalot is a game, and we hope it’s fun to play. We’d also like to pave the way for serious use of combinatorial prediction market technology.

Why did Yahoo! build this? Predictalot is a smarter market, letting humans and computers each do what they do best. People enter predictions in simple terms they understand like how one team fares against another. The computer handles the massive yet methodical number crunching needed to combine all the pieces together into a coherent overall prediction of a complex event. Markets like Predictalot, WeatherBill, CombineNet, and Internet advertising systems, to name a few, represent the evolution of markets in the digital age, empowering users with extreme customization. More and more, matching buyers with sellers — the core function of markets — requires sophisticated algorithms, including machine learning and optimization. Predictalot attempts to illustrate this trend in an entertaining way.

David Pennock
Mani Abrol, Janet George, Tom Gulik, Mridul Muralidharan, Sudar Muthu, Navneet Nair, Abe Othman, Daniel Reeves, Pras Sarkar

Wanted: Bluetooth sethead

In a typical pairing of a cell phone and a bluetooth device, the “smart” phone drives the “dumb” bluetooth. The computational brains and user interface controls live inside the cell phone together with the antenna. The bluetooth device simply follows orders. For example, a bluetooth headset acts as an alternate microphone and speaker for the phone. The bluetooth truly is an accessory to the phone.

I’d like a reverse sort of bluetooth device. A bluetooth “sethead”, if you will. The cellular antenna lives inside the earpiece, or maybe stays inside your pocket or bag — technically this is the “phone” but it is a dumb device with no screen or interface. The “bluetooth” part is the thing you hold in your hand with all the smarts: the processor, the address book, the screen, the controls, the camera, the gps, another microphone and speaker — everything you normally expect in a phone except the antenna.

Why do I want this? If it existed, I could choose any carrier with any phone. I select a dumb phone from the best carrier and a smart sethead from the best hardware company. A version of an iPod touch with a camera, microphone, and gps would make an ideal sethead.

A MiFi device comes close: it’s a dumb cellular antenna that creates as a mobile wifi hotspot that can connect you to Skype, etc. (I have one from Verizon Wireless and love it.) But it’s not “always on”. MiFi + iPod is great for making calls but not for receiving calls, so is not sufficient for replacing a cell phone.

Sure, the advent of setheads would speed the carriers’ transformation into “dumb pipes”, something they are resisting, but that is inevitable anyway.

Review of Fortune’s Formula by William Poundstone: The stranger-than-fiction tale of how to invest

What is a better investment objective?

  1. Grow as wealthy as possible as quickly as possible, or
  2. Maximize expected wealth for a given time period and level of risk

The question is at the heart of a fight between computer scientists and economists chronicled beautifully in the book Fortune’s Formula by Pulitzer Prize nominee William Poundstone. (See also David Pogue’s excellent review.*) From the book’s sprawling cast — Claude Shannon, Rudy Giuliani, Michael Milken, mobsters, and mob-backed companies (including what is now Time Warner!) — emerges an unlikely duel. Our hero, mathematician turned professional gambler and investor Edward Thorp, leads the computer scientists and information theorists preaching and, more importantly, practicing objective #1. Nobel laureate Paul Samuelson (who, sadly, recently passed away) serves as lead villain (and, to an extent, comic foil) among economists promoting objective #2 in often patronizing terms. The debate sank to surprisingly depths of immaturity, hitting bottom when Samuelson published an economist-peer-reviewed article written entirely in one-syllable words, presumably to ensure that his thrashing of objective #1 could be understood by even its nincompoop proponents.

Objective #1 — The Kelly criterion

Objective #1 is the have-your-cake-and-eat-it-too promise of the Kelly criterion, a money management formula first worked out by Bernoulli in 1738 and later rediscovered and improved by Bell Labs scientist John Kelly, proving a direct connection between Shannon-optimal communication and optimal gambling. Objective #1 matches common sense: who wouldn’t want to maximize growth of wealth? Thorp, college professor by day and insanely successful money manager by night, is almost certainly the greatest living example of the Kelly criterion at work. His track record is hard to refute.

If two twins with equal wealth invest long enough, the Kelly twin will finish richer with 100% certainty.

The Kelly criterion dictates exactly what fraction of wealth to wager on any available gamble. First consider a binary gamble that, if correct, pays $x for every $1 risked. You estimate that the probability of winning is p. As Poundstone states it, the Kelly rule says to invest a fraction of your wealth equal to edge/odds, where edge is the expected return per $1 and odds is the payoff per $1. Substituting, edge/odds = (x*p – 1*(1-p))/x. If the expected return is zero or negative, Kelly sensibly advises to stay away: don’t invest at all. If the expected return is positive, Kelly says to invest some fraction of your wealth proportional to how advantageous the bet is. To generalize beyond a single binary bet, we can use the fact that, as it happens, the Kelly criterion is entirely equivalent to (1) maximizing the logarithm of wealth, and (2) maximizing the geometric mean of gambles.

Investing according to the Kelly criterion achieves objective #1. The strategy provably maximizes the growth rate of wealth. Stated another way, it minimizes the time it takes to reach any given aspiration level, say $1 million, or your desired sized nest egg for retirement. If two twins with equal initial wealth were to invest long enough, one according to Kelly and the other not, the Kelly twin would finish richer with 100% certainty.

Objective #2

Objective #2 refers to standard economic dogma. Low-risk/high-return investments are always preferred to high-risk/low-return investments, but high-risk/high-return and low-risk/low-return are not comparable in general. Deciding between these is a personal choice, a function of the decision maker’s risk attitude. There is no optimal portfolio, only an efficient frontier of many Pareto optimal portfolios that trade off risk for return. The investor must first identify his utility function (how much he values a dollar at every level of wealth) in order to compute the best portfolio among the many valid choices. (In fact, objective #1 is a special case of #2 where utility for money is logarithmic. Deriving rather than choosing the best utility function is anathema to economists.)

Objective #2 is straightforward for making one choice for a fixed time horizon. Generalizing it to continuous investment over time requires intricate forecasting and optimization (which Samuelson published in his 1969 paper “Lifetime portfolio selection by dynamic stochastic programming”, claiming to finally put to rest the Kelly investing “fallacy” — p.210). The Kelly criterion is, astonishingly, a greedy (myopic) rule that at every moment only needs to worry about figuring the current optimal portfolio. It is already, by its definition, formulated for continuous investment over time.

Details and Caveats

There is a subtle and confusing aspect to objective #1 that took me some time and coaching from Sharad and Dan to wrap my head around. Even though Kelly investing maximizes long-term wealth with 100% certainty, it does not maximize expected wealth! The proof of objective #1 is a concentration bound that appeals to the law of large numbers. Wealth is, eventually, an essentially deterministic quantity. If a billion investors played non-Kelly strategies for long enough, then their average wealth might actually be higher than a Kelly investor’s wealth, but only a few individuals out of the billion would be ahead of Kelly. So, non-Kelly strategies can and will have higher expected wealth than Kelly, but with probability approaching zero. Note that, while Kelly does not maximize expected (average) wealth, it does maximize median wealth (p.216) and the mode of wealth. See Chapter 6 on “Gambling and Data Compression” (especially pages 159-162) in Thomas Cover’s book Elements of Information Theory for a good introduction and concise proof.

Objective #1 does have important caveats, leading to legitimate arguments against pure Kelly investing. First, it’s often too aggressive. Sure, Kelly guarantees you’ll come out ahead, but only if investing for “long enough”, a necessarily vague phrase that could mean, well, infinitely long. (In fact, a pure Kelly investor at any time has a 1 in n chance of losing all but 1/n of their wealth — p.229) The guarantee also only applies if your estimate of expected return per dollar is accurate, a dubious assumption. So, people often practice what is called fractional Kelly, or investing half or less of whatever the Kelly criterion says to invest. This admittedly starts down a slippery slope from objective #1 to objective #2, leaving the mathematical high ground of optimality to account for people’s distaste for risk. And, unlike objective #2, fractional Kelly does so in a non-principled way.

Even as Kelly investing is in some ways too aggressive, it is also too conservative, equating bankruptcy with death. A Kelly strategy will never risk even the most minuscule (measure zero) probability of losing all wealth. First, the very notion that each person’s wealth equals some precise number is inexact at best. People hold wealth in different forms and have access to credit of many types. Gamblers often apply Kelly to an arbitrary “casino budget” even though they’re an ATM machine away from replenishment. People can recover nicely from even multiple bankruptcies (see Donald Trump).

Some Conjectures

Objective #2 captures a fundamental trade off between expected return and variance of return. Objective #1 seems to capture a slightly different trade off, between expected return and probability of loss. Kelly investing walks the fine line between increasing expected return and reducing the long-run probability of falling below any threshold (say, below where you started). There are strategies with higher expected return but they end in ruin with 100% certainty. There are strategies with lower probability of loss but that grow wealth more slowly. In some sense, Kelly gets the highest expected return possible under the most minimal constraint: that the probability of catastrophic loss is not 100%. [Update 2010/09/09: The statements above are not correct, as pointed out to me by Lirong Xia. Some non-Kelly strategies can have higher expected return than Kelly and near-zero probability of ruin. But they will do worse than Kelly with probability approaching 1.]

It may be that the Kelly criterion can be couched in the language of computational complexity. Let Wt be your wealth at time t. Kelly investing grows expected wealth exponentially, something like E[Wt] = o(xt) for x>1. It simultaneously shrinks the probability of loss, something like Pr(Wt< T) = o(1/t). (Actually, I have no idea if the decay is linear: just a guess.) I suspect that relaxing the second condition would not lead to much higher expected growth, and perhaps that fractional Kelly offers additional safety without sacrificing too much growth. If formalized, this would be some sort of mixed Bayesian and worst-case argument. The first condition is a standard Bayesian one: maximize expected wealth. The second condition — ensuring that the probability of loss goes to zero — guarantees that even the worst case is not too bad.

Conclusions

Fortune’s Formula is vastly better researched than your typical popsci book: Poundstone extensively cites and quotes academic literature, going so far as to unearth insults and finger pointing buried in the footnotes of papers. Pounstone clearly understands the math and doesn’t shy away from it. Instead, he presents it in a detailed yet refreshingly accessible way, leveraging fantastic illustrations and analogies. For example, the figure and surrounding discussion on pages 197-201 paint an exceedingly clear picture of how objectives #1 and #2 compare and, moreover, how #1 “wins” in the end. There are other gems in the book, like

  • Kelly’s quote that “gambling and investing differ only by a minus sign” (p.75)
  • Louis Bachelier’s discovery of the efficient market hypothesis in 1900, a development that almost no one noticed until after his death (p.120)
  • Poundstone’s assertion that “economists do not generally pay much attention to non-economists” (p.211). The assertion rings true, though to be fair applies to most fields and I know many glaring exceptions.
  • The story of the 1998 collapse of Long-Term Capital Management and ensuing bailout is sadly amusing to read today (p.290). The factors are nearly identical to those leading to the econalypse of 2008: leverage + correlation + too big to fail. (Poundstone’s book was published in 2005.) Will we ever learn? (No.)

Fortune’s Formula is a fast, fun, fascinating, and instructive read. I highly recommend it.

__________
* See my bookmarks for other reviews of the book and some related research articles.
Recovering from swine’s infection (my blog, that is)

Odd head hackerFor the second time, a hacker (in the swine sense of the word) broke in and defaced Oddhead Blog. Once again, I’m left impressed by the ingenuity of web malefactors and entirely mystified as to their motivation.

Last week several readers notified me that my rss feed on Google Reader was filled with spam (“Order Emsam No RxOrder Emsam Overnight DeliveryOrder… BuyBuy…”).

The strange part was, the feed looked fine when accessed directly on my website or via Bloglines. Only when Google requested the feed did it become corrupted, thus mucking up my content inside Google Reader but not on my website.

(Hat tip to Anthony who diagnosed the ailment: calling curl http://blog.oddhead.com/feed/ yielded clean output, while the same request masquerading as coming from Google, curl -A ‘Feedfetcher-Google; (+http://www.google.com/feedfetcher.html; 10 subscribers; feed-id=12312313123123)’ http://blog.oddhead.com/feed/, yielded the spammed-up version.)

In the meantime, Google Search had apparently deduced that my site was compromised and categorized my blog as spam. Look at the difference between these two searches. Nearly every page containing the query terms, no matter how tangential, takes precedence over blog.oddhead.com in the results. [2009/06/23 Update: This is no longer the case: Apparently Google Search has reconsidered my blog.]

So began a lengthy investigation to find and eradicate the invader. The offending text did not appear anywhere in my WordPress code or database. Argg. I found that my plugins directory was world-writeable: uh oh. Then I found a file named remv.php in my themes directory containing a decidedly un-automattic jumble of code. Apparently this is an especially nasty bugger:

I’ve never seen a hack crop up with the tenacity of “remv.php” tho. Seriously, it’s kind of scary.

I’m still not sure how or even if an attacker used remv.php to corrupt my feed in such a subtle way. I decided on surgery by chainsaw rather than scalpel. I exported all my content into a WordPress XML file, deleted my entire installation of WordPress, reinstalled WordPress, then imported my content back in. I restored my theme and re-entered some meta data, but I still have many ongoing repairs to do like importing my blogroll and other links.

The attack was clever: a virus that sickens but does not kill the patient. The disease left my web site functioning perfectly well, making it less likely for me to notice and harder to track down. The bizarre symptom — corrupting the rss feed but only inside Google Reader — led Chris to wonder if the attacker knew I was a Yahoo! loyalist. That seems unlikely. I don’t think I have enemies who care that much. Also, the spammy feed appeared in Technorati as well. Almost surely I was the victim of an indiscriminate robot attack. Still, after searching around, I couldn’t find another example of exactly this form of RSS feed “selective corruption”: has anyone seen or heard of this attack or can find it? And can anyone explain why?

What did I learn? I learned to listen to Chris and not make him mad. 🙂

I also found a bunch of useful WordPress security tips, resources, and plugins that might be useful to others including my future self: