Challenge: Low variance craps strategy

This is the first of a series of challenge posts. I’ll pose a problem in the hopes of convincing the wise Internauts to come forth with solutions. I intend the problems to be do-able rather than mind boggling: simply intriguing problems that I’d love to know the answer to but haven’t found the time yet to work through. Think of it as Web 2.0 enlightenment mixed with good old fashioned laziness. Or think of it as Yahoo! Answers, blog edition.

Don’t expect to go unrewarded for your efforts! I’ll pay ten yootles, plus an optional and unspecified tip, to the respondent with the best solution. What can you do with these yootles? Well, to make a long story short, you can spend them with me, people who trust me, people who trust people who trust me, etc. (In lieu of a formal microformat specification for yootles offers, for now I’ll simply use the keyword/tag “yootleoffer” to identify opportunities to earn yootles, in the spirit of “freedbacking”.)


dice So, on with the challenge! I just returned from a pit stop in Las Vegas, so this one is weighing on my mind. I’d like to see an analysis of strategies for playing craps that take into account the variance of the bettor’s wealth, not just the expectation.

Every idiot knows the best strategy to minimize the casino’s edge in craps: bet the pass line and load up on the maximum odds possible. The odds bet in craps is one of the only fair bets in the casino, so the more you load up on odds, the closer the casino’s edge is to zero. But despite the fact that craps is one of the fairest games on the casino floor, it’s also one of the highest variance games, meaning that your money can easily swing wildly up or down in a manner of minutes. So on a fixed budget, craps can be exceedingly dangerous. What I’m looking for is one or more strategies that have lower variance, and are thus less risky.

So that this challenge is not vague and open ended, let me boil this overall goal down into something fairly specific:

The Challenge: Suppose that I walk into a casino with $200. I arrive at a craps table that has a $5 minimum bet and allows 2X odds. I’m looking for a strategy that:

  1. Has at least some chance of making a profit (otherwise, why bother?), and
  2. Maximizes the expected amount of time (number of dice rolls) that my $200 will last.

I prefer if you ignore the center bets in your analysis. Bonus points if you examine what happens with different budgets, table limits, and/or allowed odds. Another way to motivate this is as follows: I have a small fixed budget but want to hang around a high-limit table for as long as possible, because I get a better atmosphere, more drinks, and a glimpse of life as a high roller.

As an example, here is a strategy that appears to have very low variance: On the come out roll, bet on both the pass line and the don’t pass line. If the shooter rolls 2, 3, 7, or 11 you break even. If the shooter rolls 4, 5, 6, 8, 9, or 10, you’re also guaranteed to eventually break even. The only time you lose money is when the shooter rolls a 12 on a come out roll, in which case you lose your pass line bet and keep your don’t pass bet (i.e., you lose half your total stake). There’s only one problem with this strategy: it’s moronic. You have absolutely no possibility of winning: you can only either break even or lose. One thing you might add to this strategy to satisfy condition (1) is to take or give odds whenever the shooter establishes a point. Will this strategy make my $200 last longer on average than playing the pass line only?

For bonus points, I’d love to see a graph plotting a number of different strategies along the efficient frontier, trading off casino edge and variance. Another bonus point question: In terms of variance, is it better to place a single pass line bet with large odds, or is it better to place a number of come bets all with smaller odds?

To submit your answer to this challenge, post a comment with a link to your solution. If you can dig up the answer somewhere on the web, more power to you. If you can prove something analytically, I bow to you. Otherwise, I expect this to require some simple Monte Carlo simulation. Followed of course by some Monte Carlo verification. 🙂 Have fun!

Addendum: The winner is … Fools Gold!

CFP: Third Workshop on Sponsored Search

We’re soliciting research paper submissions and participants for the Third Workshop on Sponsored Search, to be held May 8, 2007 in Banff, Canada, in conjunction with the 16th International World Wide Web Conference (WWW2007). The workshop will have an academic/research bent, though we welcome both researchers and practitioners from academia and industry to attend to discuss the latest developments in sponsored search research. Attendance will be open to all WWW2007 registrants.

See the workshop homepage for more details and information.

Sponsored search is a multi-billion dollar industry in rapid growth. Typically, web search engines auction off advertising space next to their standard algorithmic search results. Most major search engines, including Ask, Google, Microsoft, and Yahoo!, rely on sponsored search to monetize their services. Advertisers use sponsored search to procure leads and manage their customer acquisition process. Third party search engine marketers (SEMs) help advertisers manage their keyword portfolios and bidding campaigns. Academic work on sponsored search has only recently begun.

You can indicate your intent to attend at upcoming.org, though please note that official registration must go through the WWW2007 conference.

Hope to see you in Banff!

Blogomediasphere

DictionaryIf a Frenchman with a jolly name can coin a term, sick then so can I. And so I did. In a previous post:

…no matter how surprised industry watchers were at the blogomediasphere’s glowing reception of the [iPhone]…

As it turns out, nurse it looks like at least three others have already coined the term independently, to me a positive sign that it has a certain natural ring to it. What does it mean? A shorthand for “blogosphere and traditional media” that reflects the increasingly blurry lines between them, and the symbiotic echo chamber than has grown to encompass both.

Whiners who detest the words blog and blogosphere will hate this one even more. I personally like it (enough to place a small, good-natured wager). Who wants to write the Wikipedia entry? 😉

Time's Person of the Year: Kudos and gripes

Time 2006 Person of the Year coverI finally read Time Magazine’s 2006 Person of the Year issue (as usual, I’m a month behind this guy). By now you know that the Person of the Year is “You”, meaning Internet users, meaning that user-generated content (UGC) is King.

There are some high points. Brian Williams, an old-media icon, clearly gets how his industry is changing, though his main point — that society is splintering into information silos where people “consume only what [they] wish to see and hear” — feels overblown: is the silo effect really any worse than it used to be when information was less accessible? Another op ed by Steven Johnson argues that UGC is largely filling a new niche rather than displacing professional content, and I tend to believe him. The YouTube creation story is fascinating, and seems more carefully done than the typical tales, which apparently leave out one of the three co-founders. The most entertaining piece is by Joel Stein about his foray into Second Life: hilarious!

My main complaint lies in Time’s choice of exemplars of the new world order. While YouTube is a no-brainer selection, a wonderful service, and a global phenomenon accelerated by Google’s name and $1.65 billion, Time appoints YouTube the protagonist and crown jewel, to the point where it feels like YouTube, not You, is the real Person of the Year. Meanwhile, MySpace and Yahoo! actually serve more videos to more people. Although these numbers reflect all videos, not just user-generated videos, the most popular items on YouTube are mainly not user-generated either. And it’s too early to judge YouTube’s monetize-ability and legal standing. Time even declares NetFlix a representative company. While NetFlix is certainly a great LongHighNew TailTechMedia company (I’m a subscriber), it’s not exactly indicative of UGC.

Flickr and del.icio.us are highlighted, though I don’t believe either is explicitly identified as a Yahoo! company (whereas the GooTube marriage figures prominently). In fact, I don’t recall Yahoo! being mentioned by name at all in the issue. (At this point readers may chalk up my complaint as a petty defensive gripe, and I don’t blame you: it’s certainly partly that.) So is Yahoo! failing in its publicly avowed strategy to embrace UGC and social media in a big way?

I don’t believe so. The *.yahoo.com family (still the #1 web property worldwide) is brimming with UGC: Answers, Finance, GeoCities, Groups, Local, Movies, Music, My, MyWeb, 360, Video, etc.

Yahoo! Answers by itself is now the 100th most visited web domain, capturing a 96% share of Q&A services, a growth area that already dominates traditional web search in some Asian countries. Yahoo!’s UGC strategy is perhaps most clear in its acquisitions: Flickr, del.icio.us, Konfabulator, JumpCut, Bix, MyBlogLog, etc. Mix in Yahoo!’s developer network, RSS fanaticism, and open spirit, and I find it hard to think of a company more representative of the user-genera-nation.

Irrefutable evidence of inefficient markets

I’m a big believer in the efficient market hypothesis, but IMHO Wall Street’s rapture following Steve Jobs’s sermon and the ensuing iPhone idol worship cannot possibly be explained by rational behavior. Take a look at this graph (via Midas Oracle via Silicon Valley Watcher via ValleyWag courtesy Yahoo! Finance — long live remix!):

Annotated graph of Apple's stock price during Steve Jobs's first unveiling of the iPhone, Jan 2007

Overall, Apple’s stock was up over 11% in the two days following the iPhone announcement. C’mon: no matter how closely Apple guarded the iPhone’s specs, no matter how persuasive Jobs’s rhetoric, no matter how surprised industry watchers were at the blogomediasphere’s glowing reception of the gadget, Jobs’s speech could not possibly have revealed over $8 billion in previously undisclosed information. Certainly non-insiders knew some of the details of the iPhone. Almost everyone knew that Apple would announce some sort of cell phone / iPod combo device. Moreover, the thing is not even going on sale until the summer, and then with a single carrier at a price point sure to discourage mass consumption. I’m an Apple fan, an Apple Computer Inc. investor, a Mac user for decades (and an Apple II user before that), and I’m drooling along with the rest of you over the iPhone. But still, some of that sudden $8 billion re-assessment of Apple’s worth surely stems from irrational exuberance, herding, and/or good old fashioned religious fervor.

Readers may challenge me to put my money where my mouth is and (short) sell Apple. Since I’m not doing that, take all of this with a grain of salt.

The economics of attention

Here is a fluffy post for a fluffy (but important) topic: the economics of attention.

Yahoo! is in the business of monetizing attention: that’s essentially what advertising is all about. We (Yahoo!) attract users’ attention by providing content, usually free, then diverting some of that attention to our paying advertisers. Increasingly users’ attention is one of the most valuable commodities in the world. This trend will only accelerate as energy becomes cheaper and more abundant, and thus everything we derive from energy (that is, everything) becomes cheaper and more abundant, on our way to a post-scarcity society, where attention is nearly the only constrained resource.

Today, users generally accept content and entertainment in return for their attention, though likely in the future users will be more savvy in directly monetizing their own attention. I’ve heard a number of companies and organizations large and small discuss direct user compensation. Beyond advertising, the economics of attention is important for the future of communication in general.

I haven’t found much academic writing on the topic, though I haven’t looked thoroughly. John Hagel’s piece “The Economics of Attention” is a good start, and he looks to have compiled some nice resources on the topic, though I haven’t yet investigated closely.

An organization that has garnered some attention of their own (of the Web 2.0 buzz variety) is Attention Trust. I find the description on their own website vague and impenetrable. The best explainer on Attention Trust I could find is PC4Media’s, though questions remain. The basic concept is simple enough: users should be empowered to control and monetize their own attention, including the output of their attention (e.g., their click trails, personal data, etc.). Just how Attention Trust plans to hand this power to the people seems to be the hand-wavy part of their story.

Another interesting company in this space is Root Markets, whose business is to connect both sides of the attention market in an attempt to commoditize attention. Their first product is much more specific than that: an exchange for mortgage leads.

If the absence of formal models of the economics of attention is real — and not simply a matter of my own ignorance — than it may be that some economist can make a career by truly tackling the topic in a precise and thorough way.

The wisdom of the ProbabilitySports crowd

One of the purest and most fascinating examples of the “wisdom of crowds” in action comes courtesy of a unique online contest called ProbabilitySports run by mathematician Brian Galebach.

In the contest, each participant states how likely she thinks it is that a team will win a particular sporting event. For example, one contestant may give the Steelers a 62% chance of defeating the Seahawks on a given day; another may say that the Steelers have only a 44% chance of winning. Thousands of contestants give probability judgments for hundreds of events: for example, in 2004, 2,231 ProbabilityFootball participants each recorded probabilities for 267 US NFL Football games (15-16 games a week for 17 weeks).

An important aspect of the contest is that participants earn points according to the quadratic scoring rule, a scoring method designed to reward accurate probability judgments (participants maximize their expected score by reporting their best probability judgments). This makes ProbabilitySports one of the largest collections of incentivized1 probability judgments, an extremely interesting and valuable dataset from a research perspective.

The first striking aspect of this dataset is that most individual participants are very poor predictors. In 2004, the best score was 3747. Yet the average score was an abysmal -944 points, and the median score was -275. In fact, 1,298 out of 2,231 participants scored below zero. To put this in perspective, a hypothetical participant who does no work and always records the default prediction of “50% chance” for every team receives a score of 0. Almost 60% of the participants actually did worse than this by trying to be clever.

ProbabilitySports participants' calibration
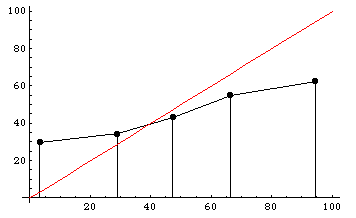
Participants are also poorly calibrated. To the right is a histogram dividing participants’ predictions into five regions: 0-20%, 20-40%, 40-60%, 60-80%, and 80-100%. The y-axis shows the actual winning percentages of NFL teams within each region. Calibrated predictions would fall roughly along the x=y diagonal line, shown in red. As you can see, participants tended to voice much more extreme predictions than they should have: teams that they said had a less than 20% chance of winning actually won almost 30% of the time, and teams that they said had a greater than 80% chance of winning actually won only about 60% of the time.

Yet something astonishing happens when we average together all of these participants’ poor and miscalibrated predictions. The “average predictor”, who simply reports the average of everyone else’s predictions as its own prediction, scores 3371 points, good enough to finish in 7th place out of 2,231 participants! (A similar effect can be seen in the 2003 ProbabilityFootball dataset as reported by Chen et al. and Servan-Schreiber et al.)

Even when we average together the very worst participants — those participants who actually scored below zero in the contest — the resulting predictions are amazingly good. This “average of bad predictors” scores an incredible 2717 points (ranking in 62nd place overall), far outstripping any of the individuals contributing to the average (the best of whom finished in 934th place), prompting someone in this audience to call the effect the “wisdom of fools”. The only explanation is that, although all these individuals are clearly prone to error, somehow their errors are roughly independent and so cancel each other out when averaged together.

Daniel Reeves and I follow up with a companion post on Robin Hanson’s OvercomingBias forum with some advice on how predictors can improve their probability judgments by averaging their own estimates with one or more others’ estimates.

In a related paper, Dani et al. search for an aggregation algorithm that reliably outperforms the simple average, with modest success.

     1Actually the incentives aren’t quite ideal even in the ProbabilitySports contest, because only the top few competitors at the end of each week and each season win prizes. Participants’ optimal strategy in this all-or-nothing type of contest is not to maximize their expected score, but rather to maximize their expected prize money, a subtle but real difference that tends to induce greater risk taking, as Steven Levitt describes well. (It doesn’t matter whether participants finish in last place or just behind the winners, so anyone within striking distance might as well risk a huge drop in score for a small chance of vaulting into one of the winning positions.) Nonetheless, Wolfers and Zitzewitz show that, given the ProbabilitySports contest setup, maximizing expected prize money instead of expected score leads to only about a 1% difference in participants’ optimal probability reports.

Evaluating probabilistic predictions

A number of naysayers [Daily Kos, The Register, The Big Picture, Reason] are discrediting prediction markets, latching onto the fact that markets like TradeSports and NewsFutures failed to call this year’s Democratic takeover of the US Senate. Their critiques reflect a clear misunderstanding of the nature of probabilistic predictions, as many others [Emile, Lance] have pointed out. Their misunderstanding is perhaps not so surprising. Evaluating probabilistic predictions is a subtle and complex endeavor, and in fact there is no absolute right way to do it. This fact may pose a barrier for the average person to understand and trust (probabilistic) prediction market forecasts.

In an excellent article in The New Republic Online [full text], Bo Cowgill and Cass Sunstein describe in clear and straightforward language the fallacy that many people seem to have made, interpreting a probabilistic prediction like “Democrats have a 25% chance of winning the Senate” as a categorical prediction “The Democrats will not win the Senate”. Cowgill and Sunstein explain the right way to interpret probabilistic predictions:

If you look at the set of outcomes estimated to be 80 percent likely, about 80 percent of them [should happen]; events estimated to be 70 percent likely [should] happen about 70 percent of the time; and so on. This is what it means to say that prediction markets supply accurate probabilities.

Technically, what Cowgill and Sunstein describe is called the calibration test. The truth is that the calibration test is a necessary test of prediction accuracy, but not a sufficient test. In other words, for a predictor to be considered good it must pass the calibration test, but at the same time some very poor or useless predictors may also pass the calibration test. Often a stronger test is needed to truly evaluate the accuracy of probabilistic predictions.

For example, suppose that a meteorologist predicts the probability of rain every day. Now suppose this meteorologist is lazy and he predicts the same probability every day: he simply predicts the annual average frequency of rain in his location. He doesn’t ever look at cloud cover, temperature, satellite imagery, computer models, or even whether it rained the day before. Clearly, this meteorologist’s predictions would be uninformative and nearly useless. However, over the course of a year, this meteorologist would perform very well according to the calibration test. Assume it rains on average 10% of the time in the meteorologist’s city, so he predicts “10% chance” every day. If we test his calibration, we find that, among all the days he predicted a 10% chance of rain (i.e., every day), it actually rained about 10% of the time. This lazy meteorologist would get a nearly perfect score according to the calibration test. A hypothetical competing meteorologist who actually works hard to consider all variables and evidence, and who thus predicts different percentages on different days, could do no better in terms of calibration.

The above example suggests that good predictions are not just well calibrated: good predictions are, in some sense, both variable AND well calibrated. So what is the “right” way to evaluate probabilistic predictions? There is no single absolute best way, though several tests are appropriate, and probably can be considered stronger tests than the calibration test. In our paper “Does Money Matter?” we use four evaluation metrics:

  1. Absolute error: The average over many events of lose_PR, the probability assigned to the losing outcome(s)
  2. Mean squared error: The square root of the average of (lose_PR)2
  3. Quadratic score: The average of 100 – 400*(lose_PR)2
  4. Logarithmic score: The average of log(win_PR), where win_PR is the probability assigned to the winning outcome

Note that the absolute value of these metrics is not very meaningful. The metrics are useful only when comparing one predictor against another (e.g., a market against an expert).

My personal favorite (advocated in papers and presentations) is the logarithmic score. The logarithmic score is one of a family of so-called proper scoring rules designed so that an expert maximizes her expected score by truthfully reporting her probability judgment (the quadratic score is also a proper scoring rule). Stated another way, experts with more accurate probability judgments should be expected to accumulate higher scores on average. The logarithmic score is closely related to entropy: the negative of the logarithmic score gives the amount (in bits of information) that the expert is “surprised” by the actual outcome. Increases in logarithmic score can literally be interpreted as measuring information flow.

Actually, the task of evaluating probabilistic predictions is even trickier than I’ve described. Above, I said that a good predictor must at the very least pass the calibration test. Actually, that’s only true when the predicted events are statistically independent. It is possible for a perfectly valid predictor to appear miscalibrated when the events he or she is predicting are highly correlated, as discussed in a previous post.

confab.yahoo: Thanks everyone!

Thanks to all two hundred and seventy (!) of you who attended the confab.yahoo last Wednesday, as far as I know a record audience for an event devoted to prediction markets. [View pictures]

Thanks for spending your evening with us. Thanks for waiting patiently for the pizza and books! Thanks to the speakers (Robin, Eric, Bo, Leslie, myself, Todd, Chris, and Adam) who, after all, make or break any conference: in this case IMO definitely “make”. The speakers delivered wit and wisdom, and did it within their allotted times! It’s nice to see Google, HP, Microsoft, and Yahoo! together in one room discussing a new technology and — go figure — actually agreeing with one another for the most part. Thanks to James Surowiecki for his rousing opening remarks and for doing a fabulous job moderating the event. Thanks to the software demo providers Collective Intellect, HedgeStreet, HSX, and NewsFutures: next time we’d like to give that venue more of the attention is deserved. Thanks to Yahoo! TechDev and Yahoo! PR for planning, marketing, and executing the event. A special thanks to Chris Plasser, who orchestrated every detail from start to finish flawlessly while juggling his day job, making it all look easy in the process.

Many media outlets and bloggers attended. Nice articles appear in ZDNet and CNET, the latter of which was slashdotted yesterday. The local ABC 11 o’clock news even featured a piece on the event [see item #35 in this report]. I’m collecting additional items under MyWeb tag ‘confab.yahoo’.

CNET and Chris Masse (on Midas Oracle) provide excellent summaries of the technical content of the event. So I’ll skip any substantive comments (for now) and instead mention a few fun moments:

  • Bo began by staring straight into the camera and giving a shoutout to Chris Masse, the eccentric Frenchman who also happens to be a sharp, tireless, and invaluable (and don’t forget bombastic) chronicler of the prediction markets field via his portal and blog.
  • Todd had the audience laughing with his story of how a prediction market laid bare the uncomfortable truth about an inevitable product delay, to the incredulousness of the product’s manager. (Todd assured us that this was a Microsoft internal product, not a consumer-facing product.)
  • I had the unlucky distinction of being the only speaker to suffer from technical difficulties in trying to present from my own Mac Powerbook instead of the provided Windows laptop. Todd later admitted that he was tempted to make a Windows/Mac quip like “Windows just works”.
  • Adam finished with an Jobsian “one more thing” announcement of their latest effort, worthio, a secret project they’ve been hacking away at nights and weekends even as they operate their startup Inkling at full speed ahead. (Yesterday Adam blogged about the confab.)

Our Yootles currency seems to have caught the public’s imagination more than any of the other various topics I covered in my own talk. (What’s wrong with you folks? You’re not endlessly fascinated with the gory mathematical details of my dynamic parimutuel market mechanism? ;-)) And so a meme is born. The lead on the Yootles project is Daniel Reeves and he is eager to answer questions and hear your feedback.

I enjoyed the confab immensely and it was great to meet so many people: thanks for the kind words from so many of you. Thanks again to the speakers, organizers, media, and attendees. I hope the event was valuable to you. Archive video of the event is available [100k|300k] for those who could not attend in person.

Musings of a computer scientist on predictions, odds, and markets